Digital Twin City 3D Services in Indonesia
Build an accurate 3D digital twin of your city or area — combining city models, photogrammetry, and point clouds in a single web platform.
A 3D Digital Twin of Your City
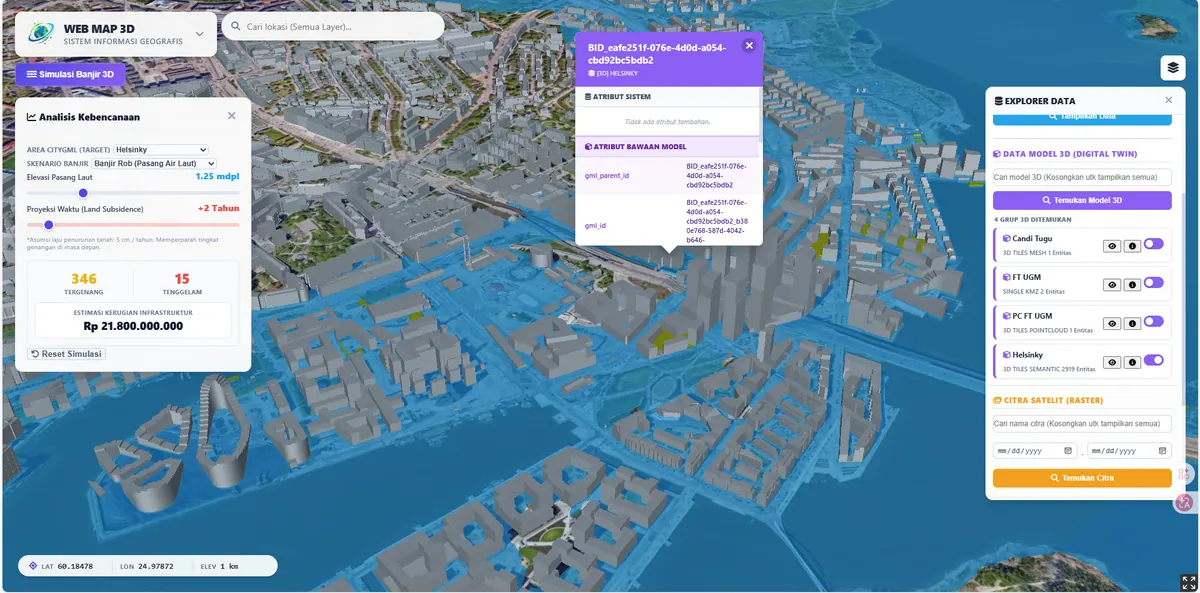
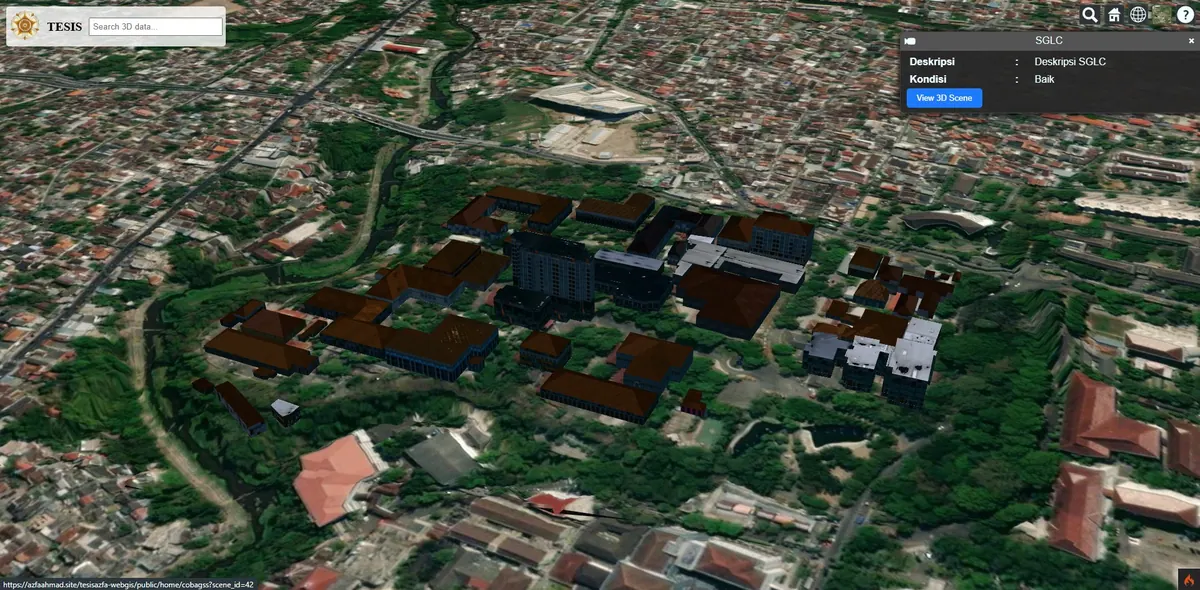
A Digital Twin City is a 3D digital representation of a city or area used for planning, simulation, and data-driven decision-making. We combine CityGML/CityJSON with 3D Tiles (photogrammetry, point clouds) and individual 3D models (GLB/KMZ) into a browser-accessible web platform.
What separates a digital twin from an ordinary 3D model is its attachment to data. An architectural 3D model stops at shape; a digital twin carries attributes on every object — building function, floor count, permit status, ownership — so the city can be queried, not just orbited. Questions like which buildings exceed the permitted height in a given zone become answerable.
3D Data Sources
Drone photogrammetry. Overlapping aerial photographs are processed into a textured model. This is the most practical route for medium-sized areas, and the output already carries real surface colour and texture.
LiDAR point clouds. Laser scanning produces highly accurate coordinated points, excellent for terrain and complex structures. Point clouds usually need classification first so buildings, vegetation, and ground can be separated.
CityGML/CityJSON. If your city already holds a semantic model, we can consume it directly. These formats carry not just geometry but the meaning of each object — wall, roof, window — which matters for downstream analysis.
Extrusion from 2D data. The most economical path: existing building footprints raised using a floor-count attribute. The result is simple blocks without roof detail, but enough for shadow, density, and sightline studies.
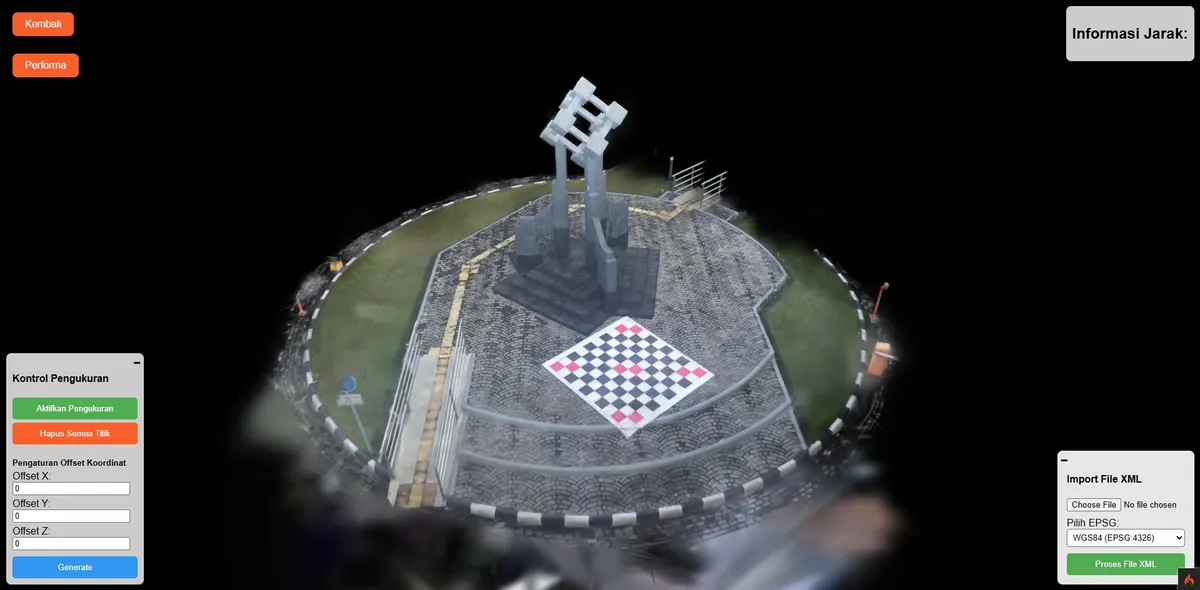
3D Gaussian Splatting. A cutting-edge rendering method that produces highly realistic views from a set of photographs. We applied it to heritage objects and published the method in the GEOID journal (ITS) — see the 3D Gaussian Splatting case study.
Level of Detail (LOD) and What It Costs
The CityGML standard defines levels of detail that drive almost the entire project cost, so this decision is best made early.
LOD1 is extruded flat-roofed building blocks. Cheap, fast, and already adequate for density analysis and rough shadow simulation. LOD2 adds real roof shapes — hipped, gabled, combined — which matters for solar-panel potential and rainwater runoff. LOD3 carries facade detail including doors and windows, requiring ground-level acquisition rather than aerial alone. LOD4 extends into building interiors.
Cost rises sharply at each level, and more detail does not always mean more value. For city-scale spatial planning, LOD1 or LOD2 is almost always the right choice; LOD3 suits limited areas that genuinely need to be shown in detail.
Use Cases
Spatial planning. Testing the visual impact of a proposed building on its surroundings before a permit is issued, including shadow and sightline analysis.
Industrial estates and property. Presenting a masterplan to prospective tenants or investors in a form they can explore themselves — far more convincing than still renders.
Disaster mitigation. Elevation models plus 3D buildings allow inundation simulation that accounts for the city's actual form.
Heritage documentation. Recording the measurable condition of historic objects, so future change or damage can be compared against a valid baseline.
Components We Can Build
- Textured 3D city models based on CityGML/CityJSON.
- Streaming of large 3D datasets via 3D Tiles (Cesium).
- Integration of photogrammetry and point clouds (LiDAR/drone).
- Individual building models (GLB/KMZ) for high detail.
- Interactive 3D navigation, measurement, and spatial analysis.
- Queryable per-object attributes surfaced as popups.
Streaming: Why 3D Tiles
A large city model cannot be loaded into a browser in one go. 3D Tiles splits the model into a hierarchy of tiles at several levels of detail, then sends only what is currently visible at a resolution matched to its distance. This is what keeps a city-sized area openable on an ordinary device.
Case Study & Readiness
Our prototype demonstrates this approach using data from Kalasatama, Helsinki — chosen because the data is open and complete, letting us show the maturity of the approach without waiting for local data availability. See the Digital Twin City case study for details. We are ready to be your Digital Twin partner for city governments, industrial estates, and developers.
Frequently Asked Questions
How is a Digital Twin different from an ordinary 3D model?
An ordinary 3D model stops at visual form. A Digital Twin carries attributes on every object — building function, floor count, permit status, ownership — so the city can be queried and analysed rather than merely orbited. That is why a Digital Twin can answer questions such as which buildings exceed the permitted height in a given zone.
Which level of detail (LOD) should we choose?
For city-scale spatial planning, LOD1 or LOD2 is almost always the right choice: far more controllable in cost and already adequate for density, shadow, and sightline analysis. LOD3 with facade detail requires ground-level acquisition and suits limited areas that genuinely need detailed presentation. Cost rises sharply at each level while the added value does not always keep pace.
Do we need to provide our own drone or LiDAR data?
Not always. If you already hold building footprints with a floor-count attribute, a 3D model can be built by extrusion with no new acquisition — the most economical route. If you already have photogrammetry, point clouds, or a CityGML model, we can consume it directly. New acquisition is only needed when your target level of detail cannot be reached from existing data.
Can a Digital Twin be opened on a phone?
Yes, because the platform runs in the browser and uses 3D Tiles, which sends only the currently visible portion at a resolution matched to distance. Experience quality still depends on the device's graphics capability and network speed, so very large areas at high detail will feel heavier on older hardware.
Why does the demo use Helsinki data rather than an Indonesian city?
Kalasatama, Helsinki was chosen because its 3D city model is openly available and complete, letting us demonstrate the technical maturity of the approach without waiting for equivalent local data. The workflow and technology are identical when applied to an Indonesian city; only the data source differs.